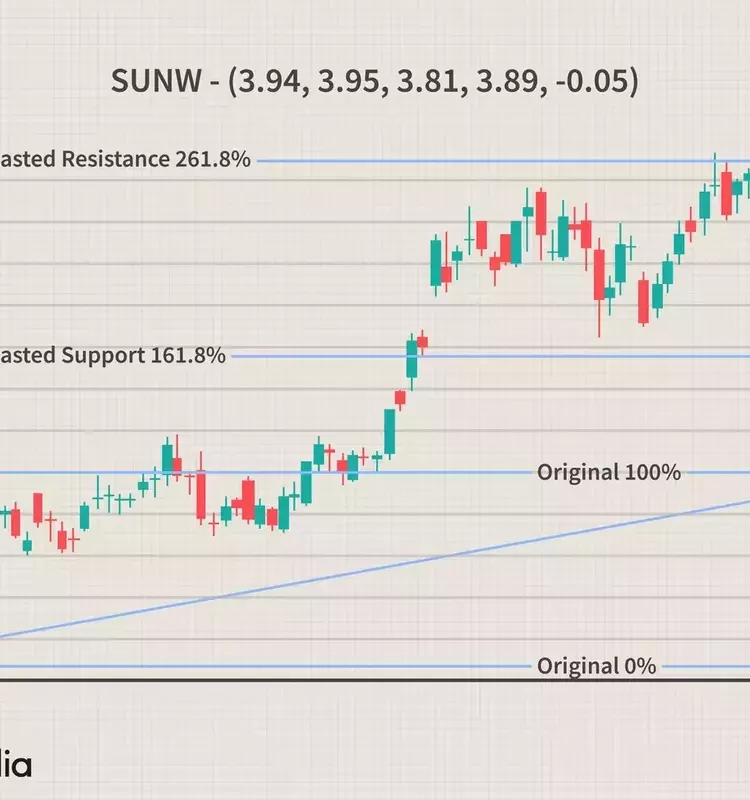
Fibonacci principles are continually evolving in financial markets. Traders seek new methods to leverage the insights offered by derivatives of the golden ratio. Moving beyond conventional Fibonacci retracements, arcs, fans, and time zones, advanced applications like extensions, clusters, and the Gartley pattern offer deeper insights. These sophisticated tools, especially when integrated with other analytical techniques, enhance the precision of market forecasting.
Delving Deeper into Fibonacci Applications
Fibonacci extensions provide projections for future support and resistance levels, serving as critical forecasting tools in technical analysis. For instance, the 161.8% and 261.8% extension levels derived from an initial price movement often act as significant future boundaries for market prices. Traders frequently integrate these extensions with wave-based analyses, such as Elliott Wave or Wolfe Wave, to predict the magnitude of price swings and delineate distinct market cycles. Additionally, extensions are applied to chart patterns like the ascending triangle; by adding 61.8% of the triangle's height to the entry price, traders can determine strategic profit-taking targets. The 161.8% Fibonacci extension is a commonly used price target when a security breaks out of an established pattern.
Fibonacci clusters are generated by combining multiple retracements from various significant price highs and lows over a specific period. When plotted on a price chart, these overlapping Fibonacci levels create denser areas, visually emphasizing the most impactful support and resistance zones. These dark-striped areas are generally considered more significant than lighter ones, offering clearer indications of market strength. Many analysts use clusters in conjunction with "volume by price" charts to identify areas where high trading volume coincides with strong Fibonacci levels, indicating robust support or resistance. This technique provides additional confirmation of key price levels when used alongside other Fibonacci methods or chart patterns.
The Gartley pattern represents a sophisticated chart formation that merges 'M' and 'W' price structures with specific Fibonacci ratios. This pattern, defined by precise proportional relationships between its points (X to D, X to B, B to D, and A to C segments), serves as a reliable predictor of future price trajectories. Traders often utilize Fibonacci retracements and extensions to measure these critical distances accurately. Specialized software and spreadsheets are also available to facilitate the identification and trading of Gartley patterns, offering a structured approach to anticipating market turns.
Fibonacci channels offer a dynamic approach to trend analysis by applying Fibonacci ratios not only vertically but also diagonally. These channels, when combined with standard Fibonacci retracements, provide additional confirmation for identifying crucial support and resistance levels. The underlying principles governing vertical retracements remain consistent when applied to diagonal channels. A common strategy involves using both diagonal and vertical Fibonacci studies to pinpoint areas where both techniques converge, suggesting strong resistance and potential continuation of the prevailing market trend.
Advanced Fibonacci tools, while powerful, are most effective when integrated with other technical indicators and chart patterns. They provide precise price targets within broader market movements. For example, a Fibonacci extension can offer a specific profit target, but its utility is maximized when coupled with an understanding of potential breakouts, confirmed by triangle patterns, volume analysis, and overall trend assessment. By synthesizing multiple indicators, traders can significantly enhance the probability of successful trades. Recognizing that no single indicator is infallible, observing multiple indicators pointing in the same direction can provide a compelling forecast for future price movements.
