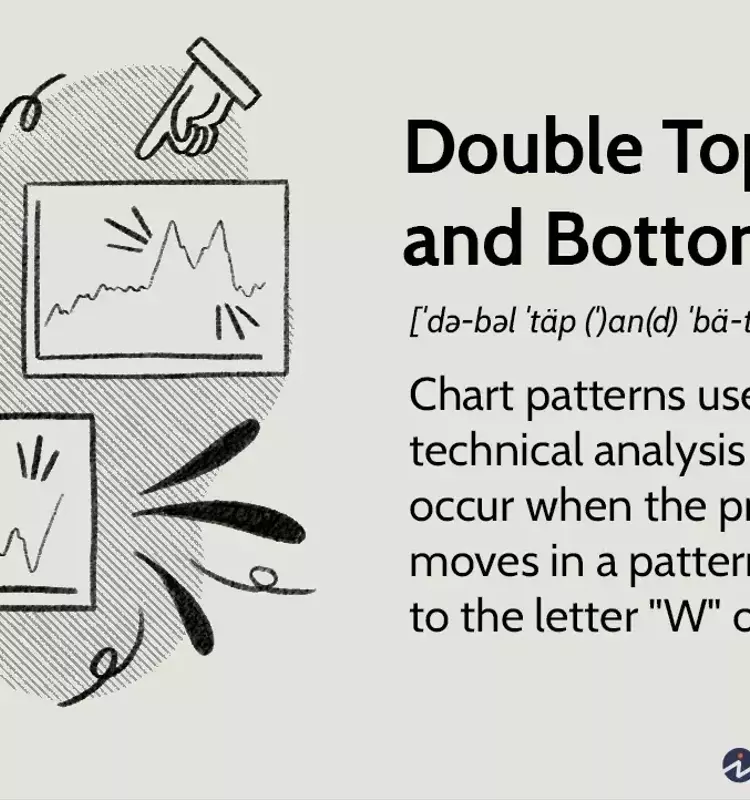
In the realm of technical analysis, the identification of double top and double bottom patterns is paramount for traders seeking to anticipate shifts in market trends. These formations, visually characterized by their distinct "M" and "W" shapes, serve as powerful indicators of potential reversals in an asset's price trajectory. While their accurate recognition can significantly enhance trading strategies, a misinterpretation of these patterns carries the risk of erroneous trading decisions, underscoring the critical need for precision and supplementary analytical tools.
Unlocking Market Reversals: The Dynamics of Double Top and Bottom Patterns
Technical analysis employs double top and double bottom patterns as fundamental tools for forecasting potential trend reversals. These patterns, often unfolding over a period, might not always present a perfectly symmetrical "M" or "W" form. The critical insight for investors is to recognize that the peaks and troughs within these patterns do not necessitate identical price levels to signal a valid formation. The dynamic nature of these patterns means they emerge from successive rounding tops and bottoms, necessitating careful observation. Employing these patterns in conjunction with other market indicators is a prudent approach, as relying solely on them can lead to "fakeouts" or misjudging a true reversal.
A double top pattern, distinguished by its "M" shape, typically emerges following an extended period of bullish market activity. The initial rounded peak suggests a market nearing exhaustion, while a subsequent, slightly lower second peak reinforces the presence of resistance and waning buying interest. These patterns, though infrequent, offer valuable insights: they hint that investors are securing profits as a bullish trend concludes, often preceding a significant bearish reversal. Traders can capitalize on this by initiating selling positions as the price declines.
Conversely, the double bottom pattern, mirroring the shape of a "W," represents the inverse scenario. These formations typically materialize after a prolonged bearish trend, with the first rounding bottom signaling the initial phase of a potential reversal. The subsequent second bottom, aligning near a critical support level, indicates that selling pressure is diminishing, paving the way for a bullish turnaround. This provides a lucrative opportunity for traders to enter long positions, aiming to profit from the anticipated upward price movement.
Despite their analytical power, double top and bottom patterns are not without limitations. Their effectiveness hinges on precise identification, as an incorrect assessment can result in substantial losses. It is imperative for traders to exercise patience and confirm these patterns by identifying critical support or resistance levels. Premature conclusions drawn from incomplete formations, such as mistaking two consecutive peaks for a definitive double top, can lead to exiting a profitable position too early. Therefore, combining these patterns with other technical indicators and maintaining a disciplined approach to market analysis is essential for successful trading.
The study of double top and bottom chart patterns offers a profound window into the cyclical nature of market trends. By understanding their formation and implications, traders can refine their strategies, transforming potential market shifts into opportunities. The interplay of market psychology, supply, and demand is vividly captured in these patterns, making them an indispensable asset for those navigating the complexities of financial markets.
