In the dynamic world of financial markets, understanding potential shifts and key levels is crucial for successful trading. This guide explores the pivot points trading strategy, a widely used technical analysis tool that helps traders navigate market volatility and make informed decisions. By utilizing historical price data, pivot points forecast future support and resistance levels, acting as critical benchmarks for market direction and potential trading opportunities. However, like all analytical instruments, their effectiveness is maximized when integrated with other technical indicators, forming a comprehensive trading approach.
Unlocking Market Dynamics: The Pivot Points Strategy
The pivot points strategy, a cornerstone of technical analysis, empowers traders to discern crucial support and resistance thresholds within financial markets. These pivotal levels are mathematically derived from an asset's previous high, low, and closing prices. By pinpointing these key price points, traders gain valuable insights into potential entry and exit opportunities for their trades. When an asset's price ascends above its calculated pivot point, it frequently signals a robust bullish trend, indicating upward momentum. Conversely, a descent below the pivot point often suggests a prevailing bearish sentiment, hinting at a downward trajectory.
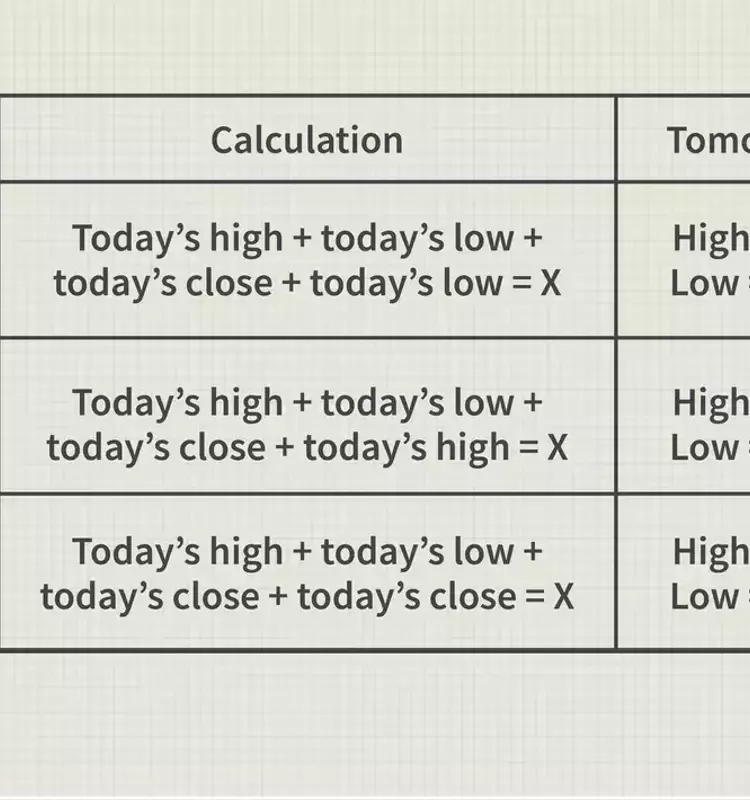
The standard methodology for calculating pivot points, known as the five-point system, incorporates the prior trading day's high, low, and closing prices, alongside two distinct support levels and two resistance levels. An alternative approach augments this calculation by integrating the asset's opening price, offering a slightly different perspective on these critical market benchmarks. It is important to note that while the mathematical underpinnings are fundamental to comprehending the strategy, most modern charting platforms automatically compute and display these pivot points, allowing traders to customize settings to their preference.
The pivot point itself represents the most significant level of support or resistance, implying that the most substantial price movements are likely to occur around this point. While other calculated support and resistance levels may exert less influence, they can still trigger meaningful price fluctuations. Traders can employ pivot points in two primary ways: first, to ascertain the overall market sentiment. A breakout above the pivot point confirms a bullish market, while a drop below it indicates a bearish outlook. Second, these price levels serve as strategic markers for executing trades. For instance, a trader might place a limit order to purchase shares if the price breaches a resistance level or set a stop-loss order near a support level to mitigate potential losses.
While pivot points can appear remarkably accurate in predicting price movements at certain times, their reliability is not absolute. No single technical tool offers infallible insights, and there will be instances where pivot levels appear to have minimal impact on price action. Therefore, the efficacy of the pivot point system ultimately rests on the trader's proficiency in integrating it with other forms of technical analysis. Complementary indicators, such as the Moving Average Convergence Divergence (MACD), candlestick patterns, or moving averages, can help validate signals and filter out false readings. By combining multiple indicators, traders can enhance the probability of successful trades. This comprehensive approach is particularly beneficial for active traders monitoring short-term price dynamics, whereas long-term investors may find pivot points less pertinent to their investment horizons.
From a journalist's perspective, the pivot points trading strategy highlights the fascinating interplay between mathematical models and real-world market behavior. It underscores the continuous quest within financial markets to predict and capitalize on price movements. The reliance on historical data to project future scenarios is a common thread in many predictive models, yet this article effectively reminds us that such tools are merely guides, not crystal balls. The emphasis on combining pivot points with other analytical methods is a testament to the complexity and inherent uncertainty of financial trading. It reinforces the idea that successful trading is less about finding a single, magic formula and more about developing a nuanced, multi-faceted approach, grounded in continuous learning and adaptive strategy. The discussion of its utility for active versus long-term traders also illuminates how different investment horizons demand distinct analytical frameworks, showcasing the diverse applications and limitations of technical tools in the vast landscape of finance.
