Mastering the Zig Zag Indicator in Financial Markets
Finance

Mastering the Zig Zag Indicator in Financial Markets

authorBy David Rubenstein
DateJul 21, 2026
Read time3 min

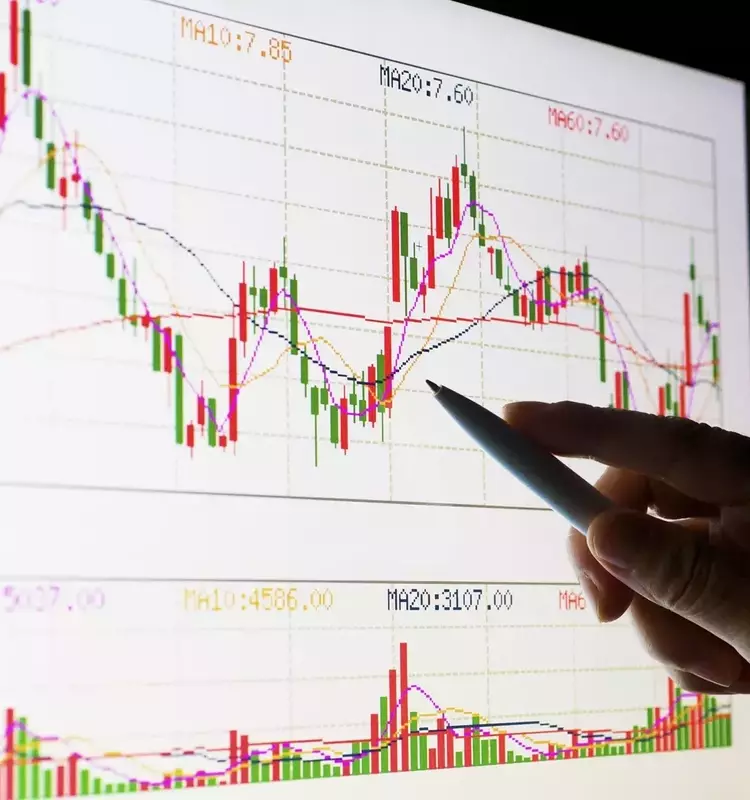
The Zig Zag indicator is a crucial technical analysis tool that simplifies market noise by focusing on substantial price movements, thereby revealing underlying trends and reversals. It effectively filters out insignificant price fluctuations, presenting a clearer picture of market direction. This tool is particularly valuable for traders who aim to identify long-term trends and potential turning points in asset prices, making complex market data more digestible.

At its core, the Zig Zag indicator plots lines connecting significant swing highs and lows, ignoring price changes below a predetermined percentage threshold. For instance, if set to 5%, the indicator will only draw a new line when the price moves 5% or more in the opposite direction from the previous extreme. This mechanism helps to visually emphasize the most impactful shifts in price, making it easier to discern the overall trend direction. Its ability to simplify price action is why it's often paired with other analytical frameworks, such as Elliott Wave Theory, to confirm wave counts and structural patterns in the market. By adjusting the percentage sensitivity, traders can tailor the indicator to suit the specific characteristics and volatility of different financial instruments.

To compute the Zig Zag indicator, one typically starts by identifying a significant price extreme (either a high or a low) and then monitors subsequent price movements. A new Zig Zag line is drawn only when the price reverses by a specified percentage from that extreme. This process is repeated, connecting these significant turning points with straight lines. This methodical construction helps in visualizing the dominant price path, aiding in the identification of market structures like double bottoms or head-and-shoulders patterns, which are often precursors to trend reversals.

Despite its utility in clarifying trends, the Zig Zag indicator has certain inherent limitations. As it relies on past price data, it is a lagging indicator, meaning it reflects what has already occurred rather than predicting future price movements. This can sometimes lead to signals appearing after a substantial portion of a trend has already unfolded. Moreover, the most recent segment of a Zig Zag line is not permanent; it can redraw if the price action does not meet the predefined percentage reversal. Therefore, traders generally use the Zig Zag indicator for confirming existing trends and identifying potential support and resistance levels, rather than as a primary tool for precise entry or exit timing. Its strength lies in providing a simplified, big-picture view of market dynamics, which can then be combined with other leading indicators like RSI or stochastic oscillators for more robust trading decisions.

In essence, the Zig Zag indicator is a powerful visualization tool for trend analysis in financial markets. It helps traders cut through daily market noise to focus on the more substantial price swings that define overarching trends. While it is not a predictive tool for market timing, its ability to highlight significant reversals and trend formations makes it an invaluable component of a comprehensive technical analysis strategy, particularly when used in conjunction with other indicators and theories like Elliott Wave analysis.

More Articles
Finance
Understanding Target-Date Funds: A Comprehensive Guide to Retirement Investing
Target-date funds (TDFs) offer a streamlined approach to retirement planning by automatically adjusting investment allocations as the target retirement date approaches. These funds begin with more aggressive growth-oriented assets and gradually transition to conservative fixed-income investments, making them ideal for investors seeking a hands-off strategy. This guide explores the mechanics, benefits, drawbacks, and crucial considerations for investing in TDFs, including fee structures and asset comparisons.
By Lisa JingJul 21, 2026
Finance
Intel's AI Resurgence: A Deep Dive into CPU Demand and Foundry Momentum
Intel Corporation has seen a significant rally in its stock, surpassing previous highs, fueled by renewed investor confidence in the role of CPUs within the evolving AI landscape. The shift from AI training to agentic AI promises increased demand for Intel's data center CPUs. The company's foundry business is also gaining traction, with its CEO, Lip-Bu Tan, being seen as a key asset in navigating industry volatility. Despite recent gains, the author maintains a 'Buy' rating due to the robust demand for data center CPUs and the positive momentum of the foundry operations.
By Nouriel RoubiniJul 21, 2026
Finance
Fidelity Blue Chip Growth Fund Delivers Exceptional Q2 Performance
The Fidelity Blue Chip Growth Fund, focusing on domestic equities with a large-cap bias and sustainable business models, achieved remarkable results in the second quarter. Its Retail Class shares saw a substantial gain of 26.39%, significantly outperforming the Russell 1000 Growth Index's 16.74% advance. This strong performance was primarily attributed to strategic investments in semiconductor-related businesses, particularly those benefiting from the burgeoning AI infrastructure sector, alongside adept security selection within the technology space.
By Nouriel RoubiniJul 21, 2026
Finance
Understanding Material Participation Tests for Tax Purposes
The IRS utilizes a framework of Material Participation Tests to ascertain a taxpayer's engagement level in various income-generating activities. This involvement dictates how losses from these activities can be treated for tax purposes. Meeting at least one of the seven established criteria can enable taxpayers to fully deduct losses, whereas failing to do so may lead to limitations under passive activity rules. These guidelines are crucial for distinguishing between active and passive income and managing tax liabilities effectively.
By Strive MasiyiwaJul 21, 2026
Finance
Understanding Investment Risk Measures
Investment risk measures are crucial statistical tools employed by investors to evaluate the potential volatility and performance of their investments. These measures help in comparing investments against established benchmark indices, offering insights into expected returns and associated risks. They are fundamental to Modern Portfolio Theory (MPT), providing a framework for informed decision-making in constructing and managing investment portfolios.
By Strive MasiyiwaJul 21, 2026