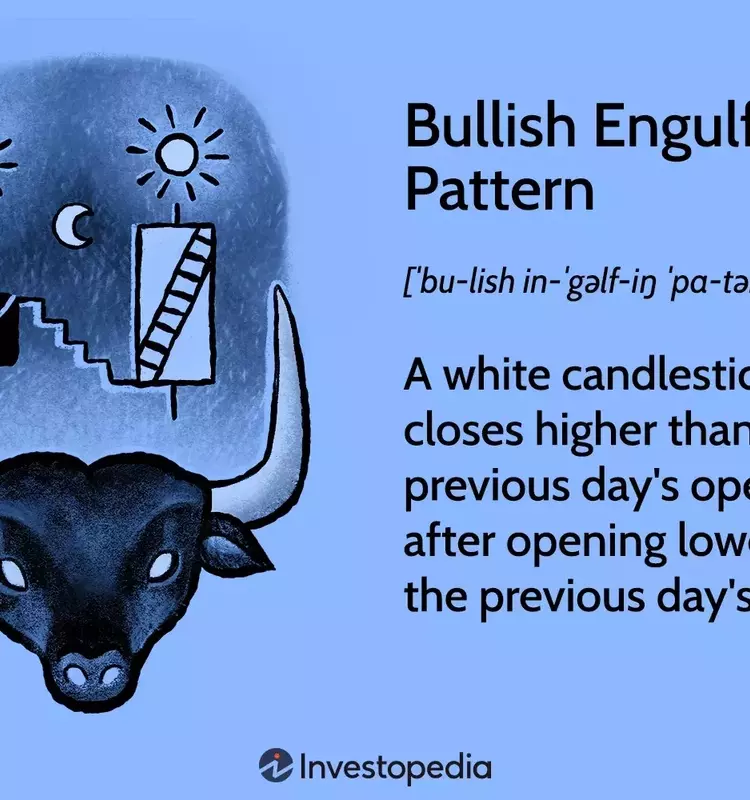
In financial markets, the bullish engulfing pattern serves as a critical indicator for identifying potential shifts from downward to upward price movements. This two-candle formation suggests a strengthening in buying sentiment, particularly when observed after a period of declining prices. However, like all technical indicators, its effectiveness is enhanced when used in conjunction with other analytical tools and an understanding of market context, as it is not without its limitations.
This pattern is characterized by a small bearish candle followed by a larger bullish candle that completely 'engulfs' the prior one, signaling a significant shift in market control from sellers to buyers. Traders often consider this a strong sign of an impending upward trend, especially if accompanied by increased trading volume. Recognizing and interpreting this pattern correctly can provide valuable insights for making informed trading decisions, though careful consideration of surrounding market conditions is always advised.
The Nature of the Bullish Engulfing Signal
A bullish engulfing pattern is fundamentally a two-candlestick setup that indicates a potential shift in market momentum from negative to positive. The first candle in this formation is a small black (or bearish) candle, signifying selling pressure or a continuation of a downtrend. The second candle is a larger white (or bullish) candle, whose body completely covers the entire body of the first candle. This complete engulfment signals that buyers have decisively taken control from sellers, pushing prices significantly higher than the previous day's trading range.
For this pattern to be truly indicative of a reversal, it typically appears at the end of a discernible downtrend. The larger the bullish candle relative to the bearish one, the stronger the signal is often considered to be. This pattern suggests that even though the market opened lower than the previous day's close, strong buying interest emerged throughout the day, leading to a higher close and effectively negating the earlier bearish sentiment. Traders often interpret this as a strong signal that the market is preparing for an upward movement.
Interpreting and Acting on the Pattern's Clues
The bullish engulfing pattern provides significant clues about investor sentiment. Its formation implies that despite an initial continuation of selling pressure (indicated by a lower open), buyers stepped in aggressively, overcoming the sellers and driving the price upward to close above the previous day's open. This robust buying activity often signals a change in market psychology, transitioning from fear and selling to confidence and buying. The absence of a long upper wick on the bullish candle further strengthens this interpretation, suggesting that the buying momentum continued until the market close.
When this pattern emerges, especially after several consecutive bearish candles, traders often view it as a compelling opportunity to initiate long positions. However, it is crucial to seek additional confirmation. This might involve waiting for the price to surpass the high of the engulfing candle on the subsequent trading day or observing an increase in trading volume during the formation of the bullish candle. While aggressive traders might enter positions immediately, more cautious investors may prefer to confirm the trend reversal with other indicators to mitigate risk, recognizing that even strong patterns have limitations, especially in volatile or sideways markets.
