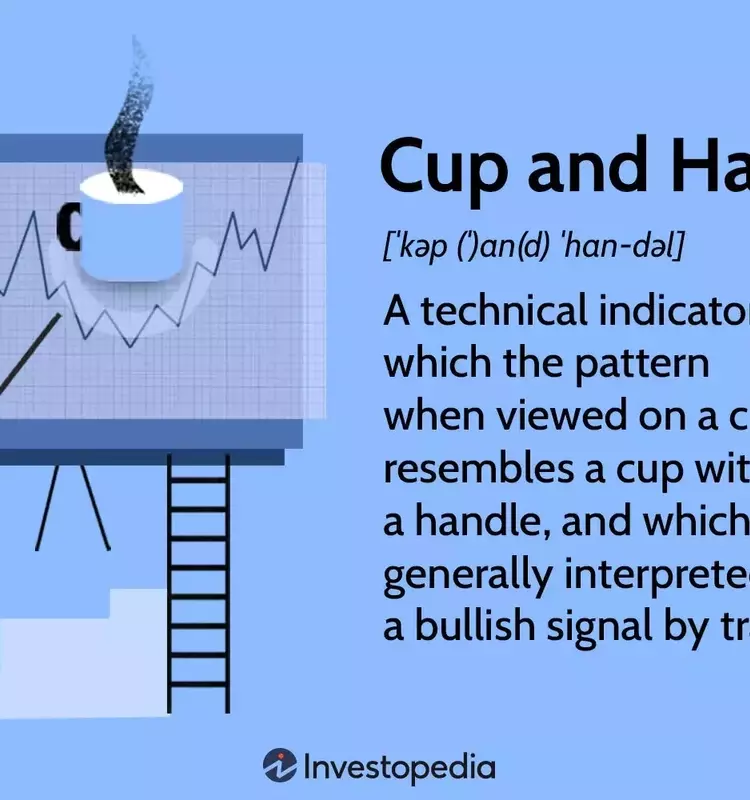
The "cup and handle" pattern, a prominent tool in technical analysis, serves as a crucial indicator for traders seeking potential upward trends in stock prices. This formation, graphically resembling a teacup on a price chart, suggests a period of consolidation followed by a potential breakout. Developed by William J. O'Neil, this pattern is widely recognized for identifying favorable buying opportunities, hinting at significant gains once the resistance level of the "handle" is surpassed. Its formation typically ranges from several weeks to over a year, and its reliable application often involves combining it with other analytical signals.
William J. O'Neil, a distinguished technical analyst, first introduced the cup and handle pattern in his seminal 1988 work, "How to Make Money in Stocks." His subsequent writings in Investor's Business Daily further elaborated on its technical prerequisites, including specific timeframes for each segment and a detailed description of the distinctive rounded bottom that gives the pattern its "teacup" appearance. This pattern acts as a bullish continuation signal, indicating that a stock, after a period of price stabilization, is likely to resume its upward trajectory. The formation suggests that previous highs, which initially acted as resistance, may soon be surpassed.
To accurately identify and interpret this pattern, several factors warrant close attention. Firstly, the "cup" should ideally exhibit a longer, more rounded "U" shape, rather than a sharp "V." A deep "V" shape can indicate a weaker pattern. Secondly, the depth of the cup should not be excessively pronounced, and similarly, the "handle" should ideally form within the upper half of the cup's structure. Thirdly, observing trading volume is crucial: it should generally decline during the downward phase of the cup and remain subdued at the cup's base. Conversely, volume should increase as the stock begins its ascent towards its previous high. Furthermore, while the handle doesn't strictly need to reach prior peaks, a greater distance from these highs might imply a more vigorous breakout once resistance is overcome.
Strategies for trading the cup and handle pattern primarily involve initiating a long position. A common approach is to place a stop-buy order slightly above the upper trendline of the handle, ensuring that the order only executes if the price breaches this resistance. This method, however, carries the risk of slippage or false breakouts. An alternative, more conservative strategy involves waiting for the price to definitively close above the handle's upper trendline. Following this, a limit order can be placed just below the breakout level, anticipating a potential price retracement before a sustained upward move. However, this carries the risk of missing the trade if the price continues its ascent without a pullback. Profit targets are typically calculated by measuring the vertical distance from the cup's bottom to the breakout level and projecting this distance upwards from the handle's breakout point. Stop-loss orders, strategically placed below the handle or cup, help manage risk based on individual risk tolerance and prevailing market conditions.
A real-world example is Wynn Resorts, Limited (WYNN). After going public in October 2002 at around $13 and soaring to $154 five years later, the stock experienced a significant downturn. This decline brought it close to its initial public offering (IPO) price, a deeper retracement than typically advised by O'Neil for a shallow cup. The subsequent recovery saw the stock reach its prior high in 2011, nearly a decade after its initial listing. The handle formed through a classic pullback, finding support at the 50% retracement level in a rounded shape, and revisited the previous high 14 months later. The stock ultimately broke out in October 2013, adding 90 points over the next five months, demonstrating the pattern's potential for substantial gains when confirmed.
Despite its utility, the cup and handle pattern, like all technical indicators, has limitations and should be used in conjunction with other signals for sound trading decisions. One significant challenge is the time required for the pattern to fully develop, which can lead to delayed trading entries. Although typical formation periods range from a month to a year, this can vary considerably, introducing ambiguity. Another concern relates to the cup's depth; while shallower cups can be valid signals, overly deep ones might produce misleading results. Additionally, sometimes the pattern emerges without a clearly defined handle, further complicating its interpretation. Furthermore, its reliability can be diminished in thinly traded stocks due to liquidity issues.
