Mastering the Descending Triangle: Unlocking Market Signals
Defining the Descending Triangle in Market Analysis
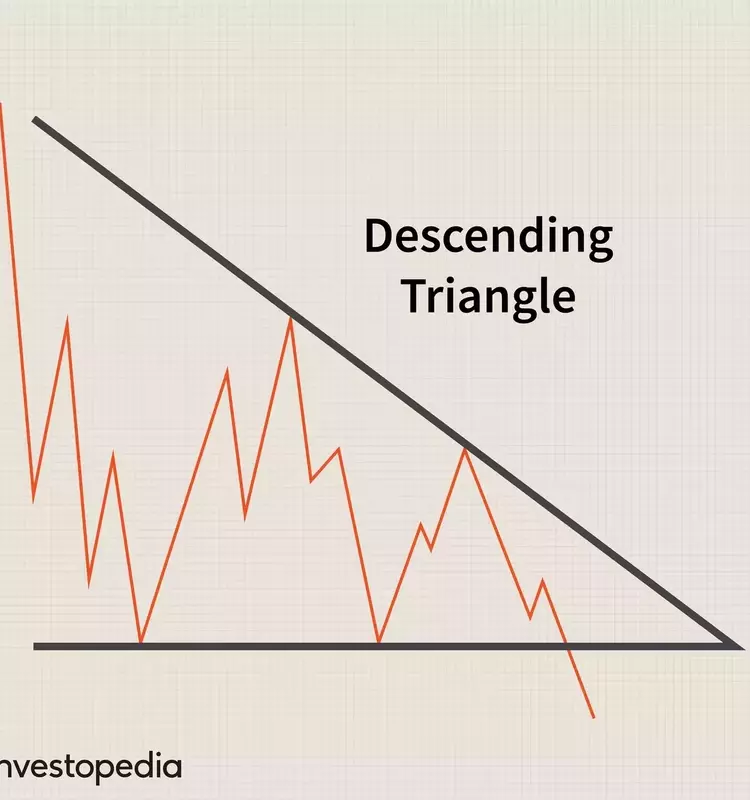
A descending triangle is a recognized chart formation within technical analysis, often suggesting either a continuation of a downward market trend or a phase of consolidation during an upward trend. This pattern is characterized by a series of lower peaks and consistent horizontal support levels, offering valuable insights into market sentiment and potential trading opportunities.
Deciphering the Indicators of a Descending Triangle
Widely utilized by market participants, descending triangles visually represent a decline in demand for a particular asset or commodity. A drop in price below the established horizontal support line typically indicates a continuation of bearish momentum. Traders frequently use this pattern to initiate short positions, aiming to profit from the anticipated price decline. The chart's horizontal base signifies a price level where buyers consistently step in, preventing further immediate drops, while the descending upper line shows that sellers are gradually gaining control at progressively lower price points.
Recognizing the Formation of a Descending Triangle
The descending triangle is one of three common triangle patterns employed in technical analysis. Its key characteristics include a pre-existing downtrend before the pattern emerges, an upper trendline that slopes downwards (formed by connecting successive lower highs), and a flat lower trendline that acts as a support level. A breakdown below this support typically signals the continuation of the downward trend.
Tactical Approaches for Trading Descending Triangles
Traders commonly establish short positions once a significant price breakdown occurs below the descending triangle's lower trendline, often accompanied by increased trading volume. The projected price target is typically calculated by subtracting the vertical height of the triangle from the entry price at the breakdown point. The upper trendline serves as a stop-loss benchmark to manage potential losses.
Breakout Strategy for Descending Triangles
This approach involves anticipating a decisive move out of the triangle pattern, integrating trading volume and trend analysis for short-term gains. In market downtrends or consolidation periods, traders look for the formation of lower peaks and lower troughs.
Leveraging Heikin-Ashi Charts with Descending Triangles
Heikin-Ashi charts, applicable across various markets, are a valuable tool in conjunction with technical analysis for identifying market trends. Traders observe the formation of a descending triangle and then use Heikin-Ashi charts to pinpoint the beginning of a bullish trend, which often precedes a breakout.
Integrating Moving Averages with Descending Triangles
Traders can combine price action analysis, such as the descending triangle, with technical indicators like moving averages. In this strategy, the descending triangle helps forecast potential breakouts, while moving average indicators provide confirmation signals for initiating trades.
Descending Triangle as a Reversal Pattern (Top)
This pattern emerges when trading volume diminishes and upward price movements become constrained, signaling the potential end of a bullish market phase. The trading opportunity arises when this reversal pattern is identified before a significant breakout.
Descending Triangle as a Reversal Pattern (Bottom)
When a descending triangle forms at the conclusion of a downtrend, it can indicate that the asset's price has found a floor, marked by a horizontal support level. If the price subsequently breaks above the triangle, traders might consider entering long positions.
Contrasting Descending and Ascending Triangles
Both descending and ascending triangles are considered continuation patterns. While the descending triangle features a downward-sloping upper trendline and a horizontal lower trendline, the ascending triangle is defined by a flat upper resistance line and an upward-sloping lower support line. Although both provide insights into potential trading opportunities and profit targets, their implications for price movement differ. Ascending triangles, while sometimes appearing at the end of a downtrend, are more frequently interpreted as bullish continuation patterns.
Understanding the Limitations of Descending Triangles
Descending triangles, like all chart patterns, are not without their limitations, and their interpretation can be subjective. False breakdowns can occur, or trendlines may need to be redrawn if price action moves contrary to expectations. If a breakdown does not materialize, the asset's price might rebound to test the upper resistance before re-approaching support levels. The more frequently prices touch the defined support and resistance lines, the greater the reliability of the pattern.
Exploring Descending Triangle Breakouts
A descending triangle often predicts a downward price breakout. A breakout occurs when an asset's price moves definitively beyond a resistance area or below a support area, signaling a potential new trend direction. A "breakdown" specifically refers to a downward price movement through a support level, indicating further declines.
Distinguishing Descending Triangles from Falling Wedges
A falling wedge typically appears within a downtrend but signals a potential bullish reversal. In contrast, a descending triangle forms after a bearish trend and usually indicates a continuation of that downward movement. While both involve converging trendlines, their implications for future price direction are distinct: the falling wedge suggests an impending upturn, whereas the descending triangle points to further declines.
The Concluding Perspective on Descending Triangles
The descending triangle, characterized by a declining upper trendline and a horizontal lower trendline, provides insights into market sentiment and directional trends. Primarily viewed as a bearish continuation pattern, it can also signify a bullish reversal if the price breaks upwards. Various trading strategies, including monitoring for breakouts and breakdowns, can be employed when this pattern emerges. It is crucial to evaluate descending triangles in conjunction with other technical indicators and market conditions to mitigate the risk of false signals and subjective interpretations, ensuring informed trading decisions.
