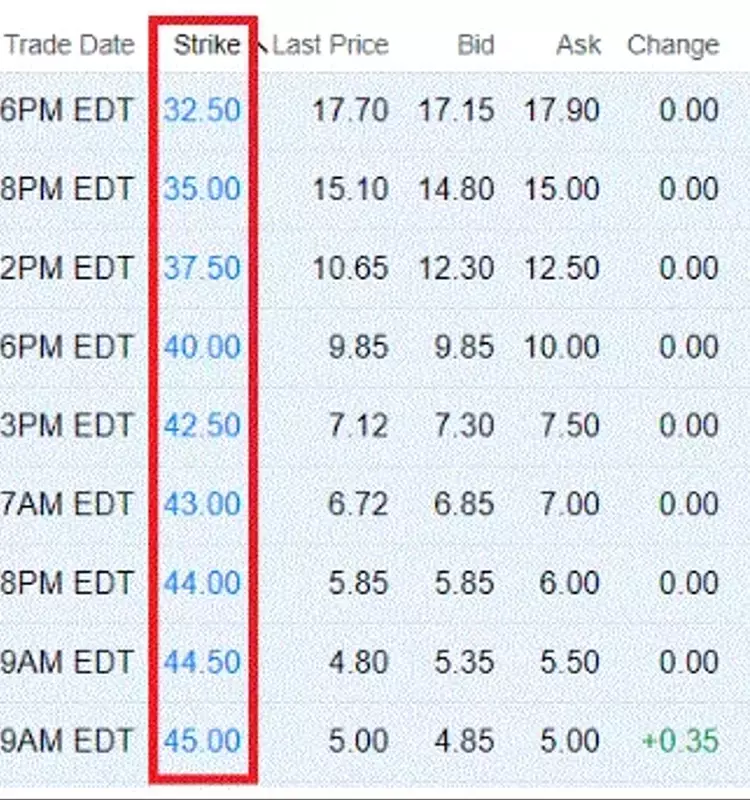
The exercise price, or strike price, is a foundational element in options trading, setting the predetermined value at which an underlying asset can be bought or sold by an option holder. This critical value directly impacts an option's profitability, categorizing it as either "in the money" (ITM) for a favorable outcome or "out of the money" (OTM) when exercising it would be disadvantageous. Understanding this concept is vital for anyone engaging in options trading, as it guides strategic decisions and dictates the potential for financial gains or losses. The relationship between the exercise price and the current market price of the underlying asset forms the core of an option's intrinsic value and is a key driver of trading strategies.
In the realm of derivatives, the exercise price serves as the fixed point against which the market price of the underlying security is measured. For instance, in call options, which grant the right to purchase an asset, an option becomes ITM if its exercise price is below the asset's current market value. Conversely, it is OTM if the exercise price exceeds the market price. For put options, which grant the right to sell, the scenario is reversed: ITM when the exercise price is above the market price, and OTM when it falls below. This dynamic is central to options trading, defining the potential for profit and the strategic considerations for investors.
Call and put options are distinct financial instruments. A call option empowers its holder to buy an asset at the exercise price, typically leveraged when an increase in the asset's market value is anticipated. This allows investors to secure an asset at a lower, pre-agreed price, profiting from the market price surge. Meanwhile, a put option grants the holder the right to sell an asset at the exercise price, serving as a protective measure against price declines or a speculative tool when a market downturn is expected. This ensures the ability to sell at a higher, guaranteed price, irrespective of falling market values.
Consider an investor, Alex, holding call options for a company, say, "Global Innovate," with an exercise price of $45 per share. If Global Innovate's stock is currently trading at $50, Alex's call options are considered ITM by $5. This situation means Alex can purchase shares at $45 through the option and immediately sell them in the market at $50, realizing a profit of $5 per share, minus the premium paid for the option. However, if Global Innovate's stock price drops to $40, and the call option's exercise price remains $45, the option becomes OTM. In this scenario, Alex would not exercise the option, as it would be cheaper to buy the stock directly from the market at $40 rather than at the option's exercise price of $45.
The value of an option is intrinsically linked to its exercise price and the market's perception of the underlying asset's future movement. An option that is deep OTM may only possess extrinsic value, based on the probability of its price moving favorably before expiration. Conversely, an ITM option gains significant intrinsic value, offering a tangible advantage over market rates. Savvy options traders constantly analyze these values, alongside other factors like volatility and time decay, to make informed decisions about when to buy, sell, or exercise their options, aiming to maximize returns and mitigate risks within the fluctuating financial markets.
