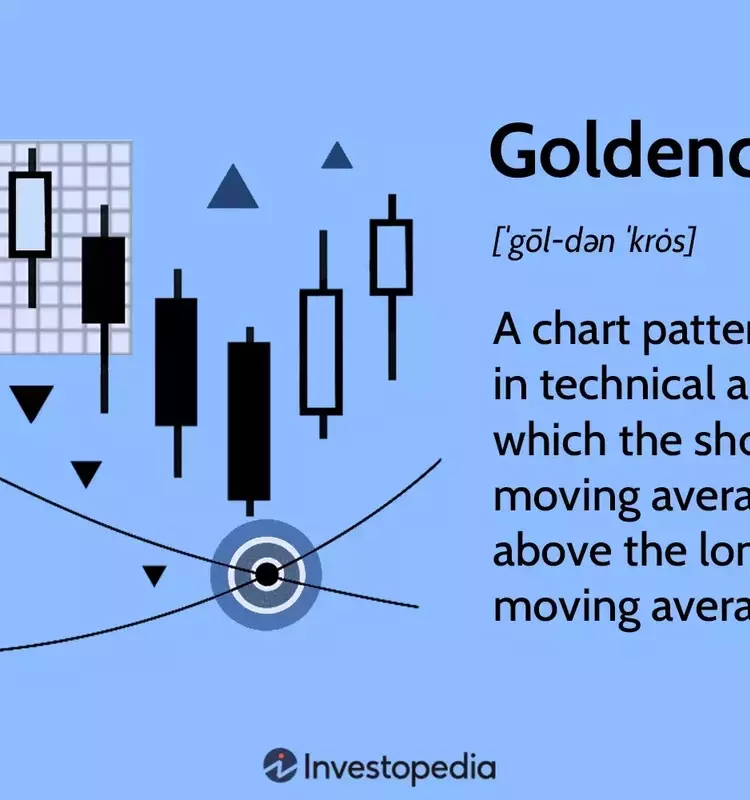
The golden cross is a key indicator in financial technical analysis, signaling a potential upward surge in market prices. This pattern forms on charts when a shorter-period moving average ascends past a longer-period moving average, indicating a shift from bearish to bullish market sentiment. It suggests that a significant rally might be on the horizon, particularly when confirmed by strong trading activity. Although it is a valuable tool for identifying emerging uptrends, its nature as a lagging indicator means it reflects past price movements. Therefore, traders often combine it with other analytical methods and robust risk management strategies to make informed decisions.
A golden cross is fundamentally a chart configuration that suggests a robust upward price movement. It is defined by the moment a relatively short-term moving average line intersects and surpasses a longer-term moving average line. This specific pattern is considered a bullish breakout, occurring when an asset's short-term average price, such as the 50-day moving average, climbs above its long-term average price, like the 200-day moving average, or a significant resistance level. The appearance of a golden cross often points towards the potential beginning of an extended period of market growth, commonly known as a bull market. The reliability of this indicator is generally enhanced when accompanied by increased trading volumes.
The golden cross is utilized in technical analysis as a momentum indicator, signaling a continuous increase in asset prices. It reflects a change in traders' and investors' perspectives from pessimistic (bearish) to optimistic (bullish). This indicator typically unfolds in three distinct phases. Initially, a prior downward trend must reach its lowest point, signifying that buyers have overcome sellers. Subsequently, the shorter-period moving average crosses above the longer-period moving average, marking a breakout and confirming the reversal of the downward trend. The final stage involves a sustained upward trend following this crossover, where the moving averages then serve as crucial support levels during any price pullbacks until a subsequent downward cross occurs.
The most common moving averages employed to identify a golden cross are the 50-day and 200-day averages. Generally, longer timeframes for these averages tend to result in more significant and enduring breakouts. For instance, the 50-day moving average moving above the 200-day moving average in major indices like the S&P 500 is widely recognized as a powerful bullish market signal. However, day traders often opt for shorter periods, such as the five-day and 15-day moving averages, for identifying intraday golden cross breakouts. Depending on their trading preferences and strategies, some traders might also use weekly or monthly intervals. It is crucial to understand that a larger chart timeframe typically corresponds to a stronger and more persistent golden cross breakout.
A golden cross, while a strong bullish signal, is not an absolute predictor of sustained upward momentum. All technical indicators, including the golden cross, are inherently lagging, meaning they are based on historical price data. This reactive nature implies that they reflect past performance rather than proactively forecasting future movements. Consequently, an observed golden cross can sometimes generate a false signal. Many times, despite its historical association with significant bull markets, golden crosses do not always lead to prolonged uptrends. Therefore, it is always recommended to corroborate a golden cross with other signals and indicators, particularly those that offer a more leading perspective, to enhance the reliability of trading decisions.
The golden cross stands as a fundamental technical tool for confirming a market shift from a declining to an ascending trend. To effectively leverage this indicator, it is essential to integrate it with supplementary analytical filters and indicators, alongside disciplined risk management techniques such as setting profit targets and stop-loss orders. Traders should always prioritize maintaining a favorable risk-to-reward ratio and executing trades judiciously, rather than blindly following the signals of the cross.
