Understanding On-Balance Volume (OBV) Indicator
Finance

Understanding On-Balance Volume (OBV) Indicator

authorBy Strive Masiyiwa
DateAug 07, 2026
Read time3 min

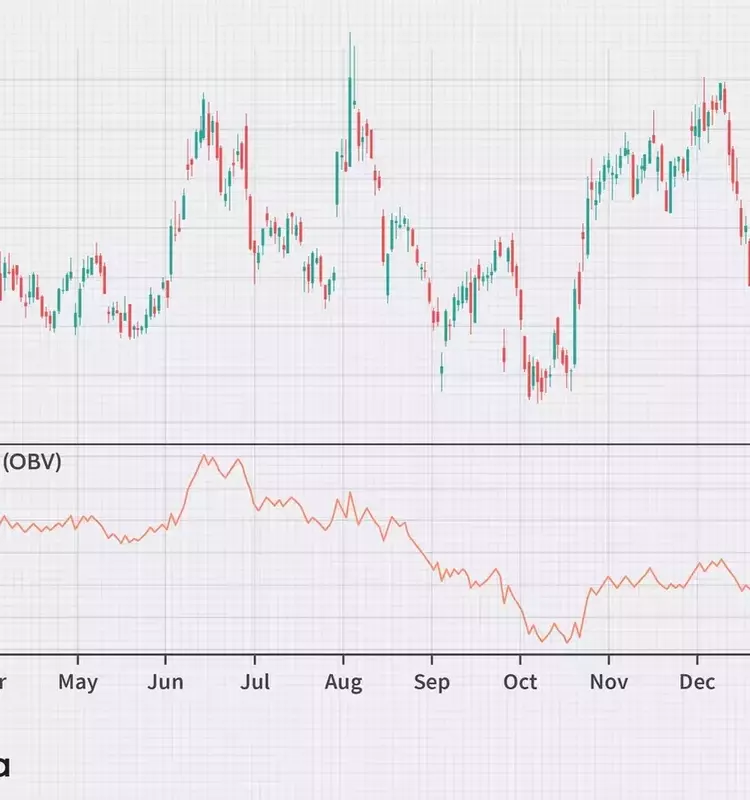
On-Balance Volume (OBV) serves as a key technical analysis indicator, created by Joseph Granville in 1963, to forecast stock price changes by evaluating the momentum of trading activity. Granville’s theory posits that shifts in trading volume often precede substantial price fluctuations. The OBV metric aims to identify when significant market movements are imminent, based on these volumetric changes. A sharp increase in volume without an immediate corresponding price shift suggests that a major price movement is likely to follow, indicating a build-up of pressure, analogous to a 'spring winding tightly'.

Gauging Market Sentiment through Volume Analysis

The core concept behind On-Balance Volume lies in discerning the activities of 'smart money', typically institutional investors, from those of individual retail investors. When large institutions start to accumulate a particular asset, the trading volume can rise considerably, even if the asset's price remains relatively unchanged. This surge in volume, driven by institutional buying, often foreshadows an eventual increase in the asset's price. Conversely, once prices escalate, larger investors may begin to divest, while smaller investors start buying into the upward trend.

While OBV is plotted on a price chart, its absolute numerical value holds less significance than its directional movement over time. The indicator is cumulative, meaning its specific value depends on the chosen starting point. Therefore, traders primarily analyze the slope of the OBV line to identify trends and potential divergences with price movements. Such divergences can reveal insights into how informed market participants are positioning themselves, offering clues about future price direction. For instance, if an asset's price is flat but its OBV is rising, it suggests that institutional investors are accumulating, potentially indicating an impending price increase.

Calculating and Interpreting On-Balance Volume

The calculation of On-Balance Volume involves a running total of an asset’s trading volume, reflecting whether volume is flowing into or out of a security or currency pair. The methodology employs three fundamental rules to update the cumulative OBV. If an asset's closing price exceeds that of the previous day, the current day's volume is added to the prior OBV. If the closing price falls below the previous day's close, the current day's volume is subtracted from the prior OBV. Should the closing price remain unchanged from the previous day, the OBV also stays constant. This cumulative process helps traders visualize the buying and selling pressure over time.

Despite its utility, OBV, being a leading indicator, is susceptible to generating premature or false signals. Its predictive nature means it offers insights into potential future movements rather than confirming past events, necessitating its use in conjunction with lagging indicators for validation. For example, integrating a moving average with OBV can help identify breakouts in the OBV line, which, if correlated with price breakouts, can provide more reliable trading signals. Furthermore, unusual spikes in trading volume due to significant news events, such as unexpected earnings reports or major institutional block trades, can distort OBV readings temporarily, making it crucial for traders to consider such external factors when interpreting the indicator.

More Articles
Finance
Santacruz Silver Mining: Positioned for Growth in a Strong Commodity Market
Santacruz Silver Mining (SCZM) presents a compelling investment opportunity, buoyed by favorable market conditions and strategic expansion plans. The company's valuation indicates a substantial discount compared to its peers. Key growth drivers include the imminent ramp-up of the Bolivar mine and the progression of the Soracaya project, both slated for significant milestones by Q4 2026. A robust financial position, consistent revenue growth, and an optimistic outlook for silver and zinc prices collectively diminish the risks associated with these expansion initiatives.
By Morgan HouselAug 07, 2026
Finance
Weekly Dividend Insights: Champions, Contenders, and Challengers
This report provides a weekly overview of dividend-related activities for companies recognized as Dividend Champions, Contenders, and Challengers. It highlights firms that have adjusted their dividend payments, details those with upcoming ex-dividend dates, and lists companies with impending pay dates. The analysis is crucial for investors tracking consistent dividend growth and payout schedules, offering a timely update that complements monthly dividend lists.
By David RubensteinAug 07, 2026
Finance
Understanding the Risk-Free Rate: A Cornerstone of Financial Analysis
The risk-free rate of return is a theoretical financial concept representing the return on an investment with no potential for loss. Typically, the three-month U.S. Treasury bill serves as a practical proxy due to the negligible risk of government default. This rate is fundamental for evaluating other investment opportunities, influencing asset pricing models, and guiding investor decisions, despite its inherent theoretical nature and susceptibility to market fluctuations.
By David RubensteinAug 07, 2026
Finance
AMERISAFE (AMSF): Navigating the Challenging Workers' Compensation Market
AMERISAFE (AMSF) specializes in high-risk workers' compensation insurance, demonstrating consistent profitability through stringent underwriting and impressive client retention exceeding 93%. Despite nine consecutive quarters of premium growth and a 5.5% dividend yield, the company faces mounting margin pressures due to rising loss ratios and a softening insurance rate environment. The second quarter of 2026 saw a notable increase in the combined ratio to 95.4% and a 17% decline in operating earnings per share, indicating a downturn in operational trends. Given that AMSF is currently trading at elevated price-to-earnings and price-to-book multiples compared to industry averages, I believe the stock is appropriately valued, leading me to maintain a neutral outlook.
By Lisa JingAug 07, 2026
Finance
Understanding Investment Benchmarks: A Comprehensive Guide
Investment benchmarks are crucial tools for evaluating the performance of financial assets, portfolios, and investment strategies. They provide a standard comparison against broader market indicators, allowing investors to gauge how well their investments are performing relative to the market. This guide delves into various types of benchmarks, including those for equities, fixed income, and commodities, and explains their practical applications in investment analysis and portfolio management.
By David RubensteinAug 07, 2026