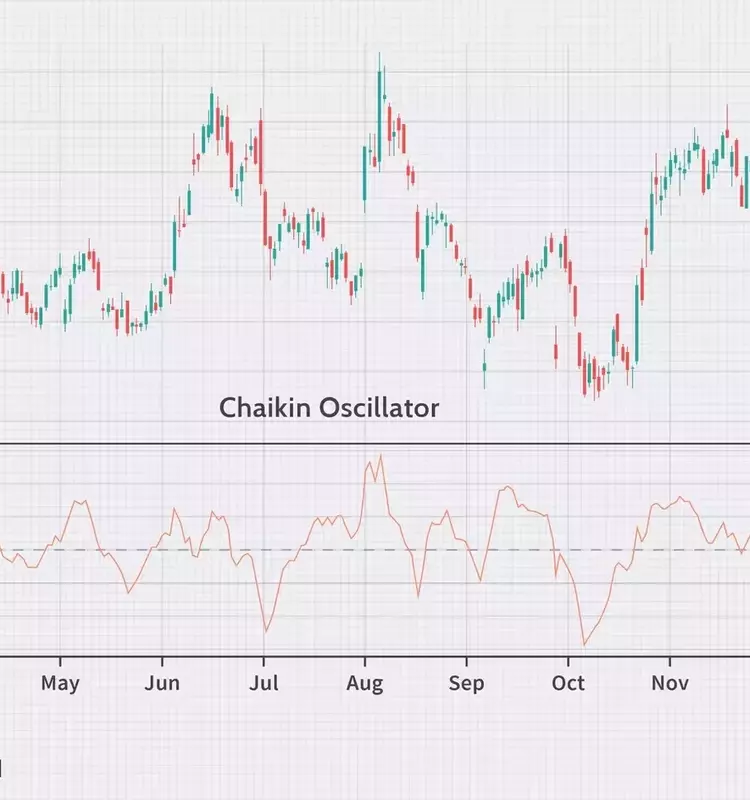
The Chaikin Oscillator is a highly regarded technical analysis instrument crafted by Marc Chaikin, designed to quantify stock momentum by meticulously tracking the intricate patterns of money flow. This powerful indicator skillfully merges concepts from Moving Average Convergence-Divergence (MACD) with the accumulation-distribution line, empowering traders to accurately identify overarching market trends and anticipate potential reversals. At its core, the Chaikin Oscillator’s methodology involves calculating the Money Flow Multiplier, then deriving the Money Flow Volume, which collectively contribute to the Accumulation-Distribution Line. The oscillator itself is then determined by the difference between the 3-day and 10-day Exponential Moving Averages of this Accumulation-Distribution Line. This sophisticated approach enables market participants to discern periods of increasing buying pressure (accumulation) versus mounting selling pressure (distribution), thereby informing more strategic investment decisions and enhancing market analysis.
The Chaikin Oscillator: A Beacon for Market Trends and Momentum Shifts
In the dynamic realm of financial markets, technical analysts perpetually seek robust tools to decipher the subtle signals of price movement and investor sentiment. Among these, the Chaikin Oscillator stands out as a critical indicator, ingeniously devised by Marc Chaikin. This oscillator serves as a sophisticated barometer for measuring market momentum, specifically focusing on the ebb and flow of money within a security. Unlike fundamental analysts who delve into a company's intrinsic value, technical analysts, including Chaikin, believe that all pertinent information is already reflected in a stock's price. Their objective is to uncover patterns and trends that foreshadow future market behavior.
The core philosophy underpinning the Chaikin Oscillator is its ability to quantify the balance between buying and selling forces, often likened to an auction where buyers represent 'accumulation' and sellers 'distribution.' When buying interest surpasses selling interest, prices tend to rise, and vice versa. The oscillator captures this delicate equilibrium, providing invaluable insights into the underlying pressure driving a stock.
The calculation of the Chaikin Oscillator is a multi-step process, beginning with the Money Flow Multiplier (N), which considers the closing price relative to the high and low for a given period. This multiplier is then integrated with trading volume to produce the Money Flow Volume (M). A continuous summation of Money Flow Volume creates the Accumulation-Distribution Line (ADL), a foundational element for the oscillator. Finally, the Chaikin Oscillator (CO) is derived by subtracting the 10-day Exponential Moving Average (EMA) of the ADL from its 3-day EMA. This short-term versus long-term EMA comparison effectively highlights shifts in momentum. A positive reading on the oscillator signals a dominance of buying pressure, suggesting bullish potential. Conversely, a negative reading indicates stronger selling pressure, signaling bearish tendencies.
Traders leverage these signals to formulate practical strategies. A pivotal insight comes from divergences: a positive divergence occurs when the oscillator crosses above its baseline (the accumulation-distribution line), signaling potential accumulation and a bullish outlook. Conversely, a negative divergence, where the oscillator falls below the baseline, suggests increasing distribution and a bearish sentiment. These divergences are crucial for identifying turning points and confirming trend strength. For instance, if a stock price is trending upwards, a positive Chaikin Oscillator reinforces the bullish momentum, whereas a negative reading might warn of an impending reversal or consolidation phase.
It is imperative for investors and traders to remember that no single indicator provides infallible predictions. The Chaikin Oscillator, while powerful, performs optimally when used in conjunction with other technical analysis tools. Combining it with complementary indicators allows for a more comprehensive market perspective, bolstering the accuracy of trading decisions and enhancing overall investment strategies. This multi-indicator approach helps filter out false signals and provides a more robust framework for navigating the complexities of financial markets.
The Chaikin Oscillator offers a profound perspective on market dynamics, moving beyond simple price movements to reveal the true underlying forces of supply and demand. Its methodology, rooted in volume and moving averages, equips traders with a nuanced understanding of momentum, helping them to anticipate market shifts and make more informed decisions.
