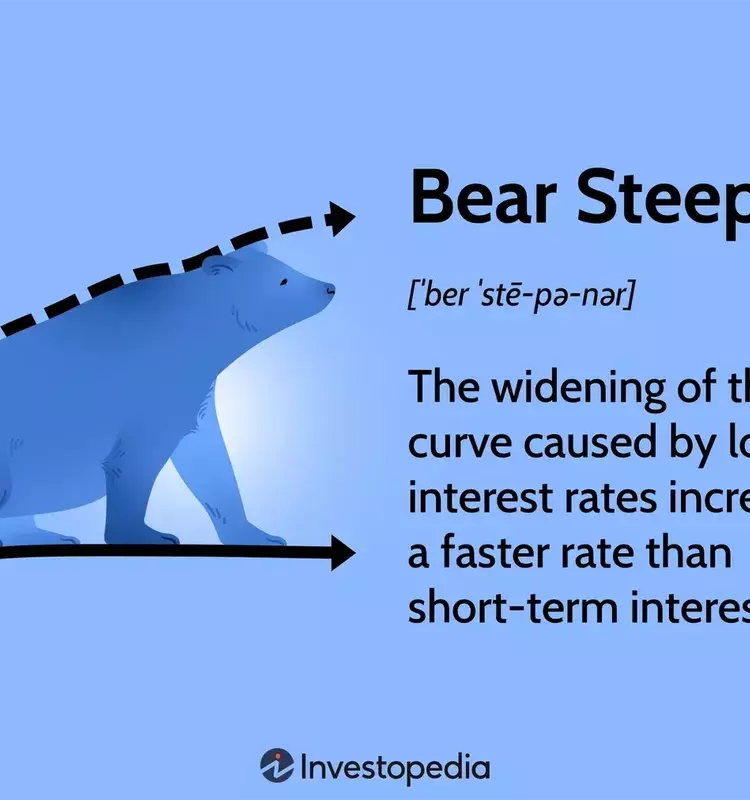
A bear steepener is a significant financial market occurrence characterized by long-term interest rates rising disproportionately faster than their short-term counterparts, thereby causing a noticeable expansion of the yield curve. This economic indicator frequently foreshadows an anticipated increase in inflation and potential policy shifts by the Federal Reserve towards higher interest rates. Such a scenario prompts investors to reconsider their bond portfolios, often leading to a divestment from long-term bonds in favor of shorter-term instruments, as a defense against diminishing returns in a climate of escalating rates. The intricate dynamics of the yield curve are indispensable for investors, particularly amidst economic uncertainties, as they guide informed decision-making and the optimization of bond portfolios.
The Intricacies of a Bear Steepener in the Financial Landscape
A bear steepener materializes when the variance between short-term and long-term bond yields expands, predominantly because long-term rates ascend more sharply than short-term rates. In the financial markets, U.S. Treasuries are often utilized as a barometer for interest rate movements. These governmental debt instruments offer a specific rate of return, or yield, to investors.
The yield curve visually articulates the divergence between short-term and long-term yields across various bonds. The short end of this curve is primarily shaped by the market’s expectations regarding Federal Reserve policy, ascending when rate hikes are anticipated and declining when cuts are foreseen. Conversely, the long end of the yield curve is influenced by a broader array of factors, including inflation forecasts, investor demand, economic expansion, and the trading activities of large institutional investors in fixed-income securities.
In a standard economic climate, the yield curve typically exhibits an upward slope, signifying that short-term bonds yield less than long-term bonds. However, when the curve flattens, it indicates a contraction of the spread between long-term and short-term rates, often occurring when short-term rates climb faster than long-term yields, or when long-term rates decline more rapidly. Conversely, a steepening of the yield curve, particularly when long-term rates surge ahead of short-term rates, is termed a bear steepener. This nomenclature stems from its typical bearish implications for equity markets, as rising long-term rates signal inflation and impending Federal Reserve rate hikes. Such rate increases can decelerate economic activity due to higher borrowing costs, potentially leading to investor sell-offs in the equity markets. Bond traders can capitalize on this widening spread by adopting a strategy of holding short-term bonds and shorting long-term bonds, effectively establishing a net short position. This approach allows them to profit from the increasing yields and widening spread.
To illustrate, consider a situation on November 20, 2019, where the 10-year Treasury note yielded 1.73% and the 2-year note yielded 1.56%, resulting in a modest spread of 17 basis points. Two months later, if the 10-year yield surged to 2.73% and the 2-year to 1.86%, the spread would widen significantly to 87 basis points. This scenario exemplifies a bear steepener, as the long-term rate experienced a 100-basis-point increase, considerably greater than the 30-basis-point rise in the short-term rate over the same timeframe. This contrasts with a bull steepener, where a steepening curve is driven by a more pronounced decline in short-term rates, typically signaling a more optimistic outlook for equity markets and economic stimulus.
The landscape of financial markets is ever-evolving, presenting both challenges and opportunities. The concept of a bear steepener serves as a potent reminder of the intricate interplay between interest rates, inflation, and market sentiment. For those navigating the complexities of investment, a thorough understanding of these dynamics is not just academic; it is an essential compass guiding strategic decisions and portfolio resilience. By keenly observing the subtle shifts in the yield curve, investors can better anticipate economic headwinds and tailor their approaches to safeguard and grow their assets. In essence, the bear steepener is more than a financial term; it’s a critical lens through which to view and interpret the broader economic narrative, urging vigilance and adaptability in investment practices.
