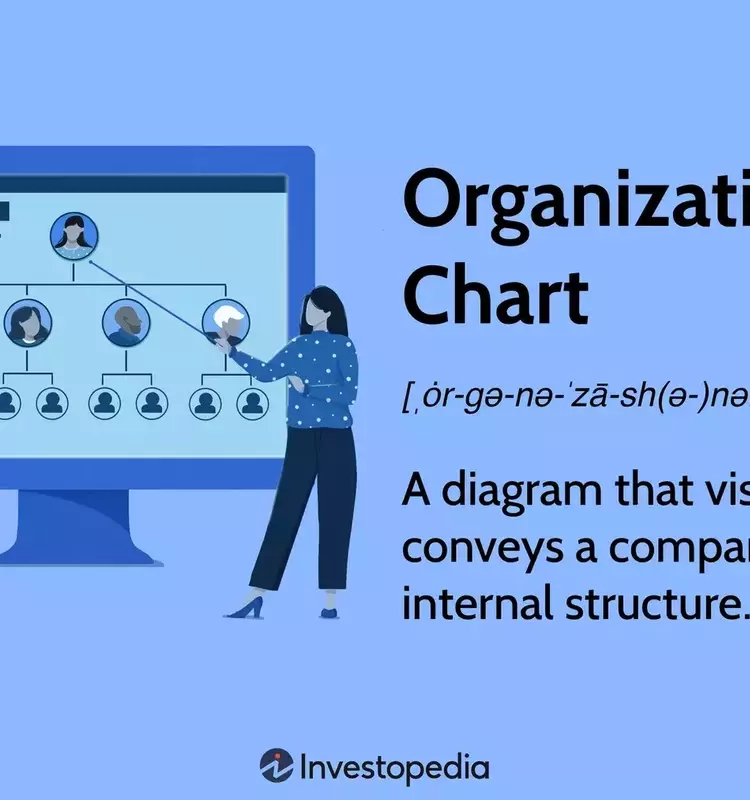
Organizational charts serve as essential visual blueprints for any entity, whether it's a corporation, a nonprofit, a government agency, or a military unit. They graphically represent the internal structure, defining who reports to whom and how different departments and individuals interrelate. These charts are invaluable for clarifying roles, responsibilities, and lines of authority, thus streamlining communication and decision-making processes within the organization.
These diagrams can provide a comprehensive view of an entire organization or focus on the intricate details of a specific division or team. They typically employ simple graphical elements like boxes and connecting lines to illustrate job titles and their relationships. This visual representation allows stakeholders, from new hires to senior management, to quickly grasp the operational landscape and understand where each role fits into the larger corporate ecosystem.
The utility of organizational charts extends beyond mere representation. They are particularly crucial during periods of internal change, such as restructuring or management shifts, as they offer a clear snapshot of the proposed changes. By transparently mapping out the organizational design, these charts help employees understand their position and contribution to the company's overall objectives, fostering a more informed and engaged workforce.
The most common form is the hierarchical organizational chart, which places the most senior figures at the pinnacle, with subordinate roles arrayed beneath them in descending order. For instance, in a publicly traded company, the hierarchy typically starts with shareholders, followed by the board of directors (chair, vice-chair, and members), and then the chief executive officer (CEO) and other C-suite executives, often connected horizontally to denote peer relationships. Below these top-tier positions, the chart would delineate roles such as president, various levels of vice presidents, directors, managers, and finally, full-time, part-time employees, and contractors.
Beyond the traditional hierarchical model, other types of organizational charts cater to different structural philosophies. Flat or horizontal charts emphasize a more egalitarian distribution of power and encourage autonomous decision-making by positioning individuals at similar levels. Matrix charts are designed for more complex environments where individuals might report to multiple managers, such as a project manager and a functional manager, highlighting cross-functional collaboration. Divisional charts are structured around specific criteria like product lines or geographical regions, allowing large organizations to manage diverse operations effectively.
Ultimately, the core function of an organizational chart is to offer a clear, visual interpretation of how an organization operates and how its members contribute to its mission. While there isn't a single universal format, the key is to accurately reflect the internal dynamics and relationships, providing a practical tool for internal clarity and strategic planning.
