Volatility skew is a crucial concept in financial markets, reflecting variations in implied volatility across different option strike prices. This phenomenon offers profound insights into prevailing market sentiment and expectations regarding future price trajectories. Understanding these skew patterns is vital for accurately pricing options and formulating effective trading strategies. By delving into the underlying causes and implications of volatility skew, market participants can better position themselves to make judicious financial choices.
Volatility skew primarily emerges from the collective expectations and actions of market participants. When investors anticipate a significant price movement in a particular direction, they often demonstrate a greater willingness to pay a premium for options that would capitalize on such a move. This heightened demand, in turn, inflates the implied volatility of those specific options, thereby creating a discernible skew.
A notable factor contributing to volatility skew, particularly in equity markets, is the investor's perception of downside risk. The potential for stock prices to plummet to zero is often considered more significant than their theoretical limitless upside. Consequently, investors frequently prioritize purchasing put options, which gain value as prices decline, over call options, which appreciate with rising prices. This asymmetry in demand leads to elevated implied volatility for out-of-the-money (OTM) put options, manifesting as a negative volatility skew.
Moreover, specific market-moving events, such as corporate earnings reports or significant economic announcements, can induce temporary volatility skews. If these events are expected to trigger substantial price fluctuations, investors may be inclined to pay more for options positioned to profit from these anticipated movements. This can create a transient volatility skew that typically dissipates once the event has occurred. Historical events, such as major market downturns like the 1987 stock market crash, serve as prime examples where investors rapidly acquired put options to hedge against further losses, leading to pronounced volatility skews.
The characteristic shape of the volatility skew offers valuable clues regarding market expectations and potential future price shifts. While this analysis provides insightful indicators, it is imperative for traders and investors to remember that these are merely expectations, and actual market movements may deviate. Implied volatility values are commonly derived using models such as the Black-Scholes option pricing model or its adaptations.
Deciphering volatility skew necessitates a keen understanding of its form and gradient. Here are some common interpretations of volatility skew:
- Positive or Forward Skew: A positive skew signifies that out-of-the-money (OTM) call options exhibit higher implied volatility compared to OTM put options. This pattern is frequently observed in commodity markets, where unforeseen spikes in demand can precipitate considerable price surges. A positive skew generally signals market anticipation of an upward price trend.
- Negative or Reverse Skew: Conversely, a negative skew indicates that OTM put options possess greater implied volatility than OTM call options. This is a common occurrence in equity markets, where investors tend to be more apprehensive about potential price declines and are thus prepared to pay more for put options to safeguard their investments. A negative skew implies market expectation of a downward price movement.
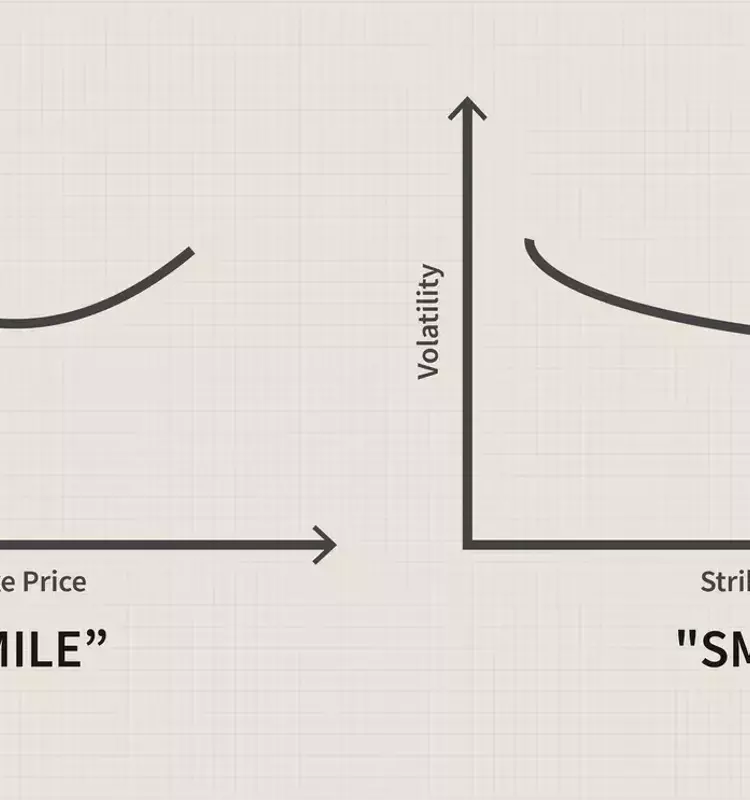
- Volatility Smile: A "smile" shape emerges when the implied volatility of both OTM call and put options surpasses that of at-the-money (ATM) options. This phenomenon often characterizes markets marked by high uncertainty or expectations of substantial price movements in either direction.
- Flat or No Skew: The absence of a skew suggests that implied volatility remains consistent across all options, irrespective of their strike price. This typically indicates that the market does not foresee significant price fluctuations in any particular direction.
Traders and investors should consistently monitor the volatility skew and adjust their strategies accordingly. Furthermore, the skew should always be evaluated in conjunction with other pertinent market indicators.
Volatility skew analysis is instrumental in identifying periods of abnormal market volatility. A significant alteration in the volatility skew can signal such anomalies. For instance, an intensifying negative skew, where the implied volatility of OTM put options rises relative to call options, might suggest that investors are bracing for a substantial downward price movement, which would invariably be accompanied by increased volatility. Comparing the current volatility skew against its historical benchmarks can help traders discern whether prevailing market expectations are unusual. A notable divergence from the historical average could indicate an expectation of abnormal volatility. Additionally, a volatility smile, where implied volatility is higher for both OTM and in-the-money (ITM) options than for ATM options, suggests that the market anticipates considerable price swings in either direction, pointing to abnormal volatility. A steep skew, characterized by wide variations in implied volatility across different strike prices, can also be indicative of abnormal market volatility. However, it is crucial to remember that volatility skew should not be used in isolation. Other factors, including market news, economic data, and various technical analysis tools, must be considered when evaluating the likelihood of abnormal volatility.
A volatility smile manifests when the implied volatility of options on a specific underlying security or market index increases as the options move further into or out of the money, with the lowest point typically occurring at-the-money. This pattern is usually depicted as a V-shaped curve, indicating heightened expectations for large price movements on either side. This smile has profound implications for options pricing and market sentiment. A steep smile suggests that the market anticipates significant price movements, leading to higher prices for options with strike prices in the "wings" (far ITM or OTM) compared to those where implied volatility is flat. It also reflects perceived market risk, with a steeper smile often indicating a higher risk of large price swings. While theoretically hinting at arbitrage opportunities, these are often challenging to exploit due to market frictions. A pronounced volatility smile can also signal "jump risk," or the potential for sudden, large price changes due to events like earnings announcements. Furthermore, the existence of a volatility smile underscores the limitations of traditional options pricing models, such as Black-Scholes, which assume constant volatility irrespective of strike price.
A volatility smirk, conversely, arises when implied volatility for options on an underlying asset or index declines as the options become more deeply in-the-money or out-of-the-money. This pattern typically forms a downward-sloping curve, resembling a smirk. This phenomenon carries significant implications for options pricing, market expectations, and risk management. A steep smirk indicates that the market anticipates a substantial downward price movement, as evidenced by significantly higher implied volatility for OTM put options compared to ATM or ITM options. This, in turn, makes OTM put options more expensive. The shape of the smirk also provides insights into perceived market risk, particularly a higher risk of large downward price movements. Similar to volatility smiles, smirks can suggest potential arbitrage opportunities, though these are often difficult to capitalize on. They also highlight the presence of "jump risk" due to impending events. Moreover, the existence of a volatility smirk serves as a reminder of the limitations of the Black-Scholes model, which assumes constant volatility across strike prices, an assumption not always valid in real-world markets. The visual representation of a volatility skew, as illustrated in the provided image, clearly demonstrates how implied volatility can differ across various strike prices.
Analyzing volatility in financial markets offers critical benefits, yet it is also subject to limitations. Volatility serves as a primary indicator of risk, with higher volatility generally correlating to greater potential price fluctuations. This information assists investors in evaluating the risk profiles of diverse assets and portfolios, facilitating effective diversification strategies. Given that volatility is a key determinant in pricing derivatives like options, elevated volatility typically results in higher option premiums. Furthermore, shifts in volatility can illuminate market sentiment, with increasing volatility often signaling heightened uncertainty or fear among market participants. Traders leverage volatility insights to shape their investment approaches, employing strategies such as straddles or strangles in environments characterized by high volatility. However, the analysis of volatility is inherently constrained by factors such as calculation methodologies, stability issues, assumptions of normal distribution, volatility clustering, and a lack of directional predictability. Historical volatility, derived from past price movements, may not always accurately forecast future volatility. Implied volatility, while forward-looking and based on option prices, is dependent on market expectations, which can be fallible. Volatility itself is highly dynamic, reacting swiftly to market events, thus complicating accurate predictions. Many models also incorrectly assume that price changes adhere to a normal distribution, whereas financial returns frequently display skewness and kurtosis, reflecting asymmetrical and fat-tailed distributions. The phenomenon of volatility clustering, where periods of high volatility are succeeded by further high volatility, and similarly for low volatility, further complicates precise analysis. Crucially, volatility measures only the magnitude of price changes, not their direction, meaning high volatility could signal significant increases, decreases, or a mix of both. Ultimately, volatility analysis is a valuable tool for risk assessment and strategy formulation, but it must be applied with an awareness of its inherent limitations and in conjunction with other market indicators.
