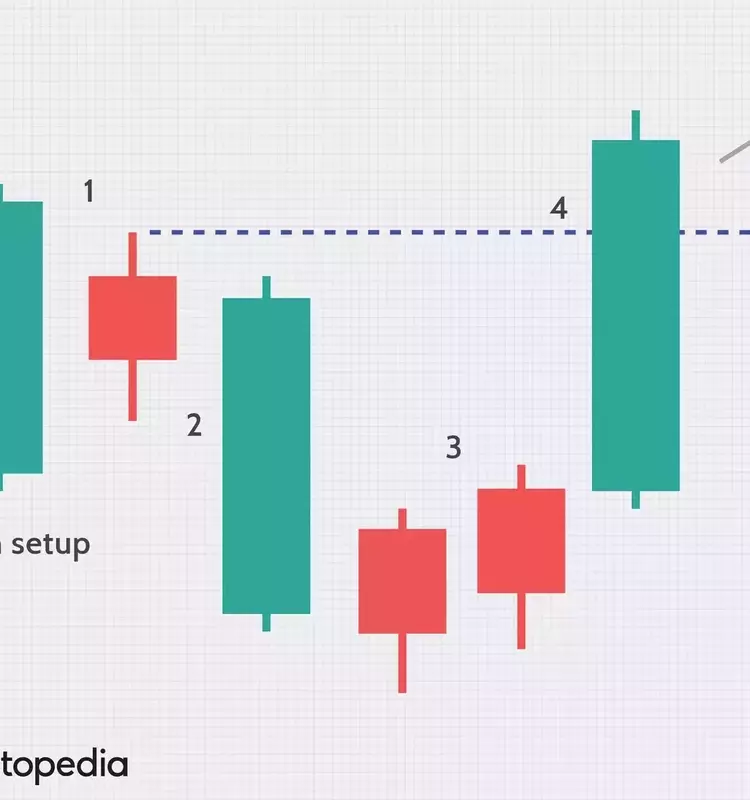
The Hikkake pattern, a tool within technical analysis, serves to anticipate short-term fluctuations in market prices by examining distinct price formations. This strategy operates on the principle of observing initial price movements that appear to trend in one direction, only for them to abruptly reverse, frequently leading to significant breakouts. It gained prominence through the work of Daniel L. Chesler, CMT, who documented its mechanics. The core idea behind Hikkake is to identify situations where traders might be misled by an apparent trend, only for the market to pivot unexpectedly, thus "trapping" those who committed too early. Understanding this pattern enables traders to refine their tactical decisions, spotting potential reversals and aligning their short-term trading strategies accordingly.
Understanding the Mechanics of the Hikkake Pattern
The Hikkake pattern, conceived by Daniel L. Chesler, CMT, and first introduced in 2004, is a distinctive technical analysis formation in financial markets. This pattern is characterized by a deceptive initial movement, which seems to indicate a certain market direction, only to swiftly reverse and signal a shift in the opposite direction. It unfolds across four critical stages, primarily observed through candlestick or bar charts. Initially, the pattern begins with two consecutive candles displaying decreasing size, forming what is known as an "inside-day" or a "harami" candlestick formation, where the first candle's body completely encompasses the second's, regardless of their closing positions relative to their opening. Subsequently, the third candle closes beyond the range of the second candle's low (in a bullish setup) or high (in a bearish setup). Following this, one or more candles may continue to move past the third candle's boundary, often hinting at a reversal. The pattern culminates with the final candle closing either above the second candle's high (for a bullish signal) or below its low (for a bearish signal).
This "hook, catch, ensnare" pattern derives its name from a Japanese term, illustrating how it can trap unwary traders into making premature commitments. For instance, in an apparent breakout indicated by the third candle, traders might rush in, placing stop-loss orders. However, if the market reverses as per the Hikkake pattern, these stop-loss orders are triggered, potentially intensifying the price movement beyond the initial second candle's range. An example observed in Microsoft shares illustrates a bullish Hikkake setup, adhering to all four characteristics, which was followed by a moderate upward trend. However, it's crucial to acknowledge that not all Hikkake patterns consistently lead to the predicted market direction. Therefore, while providing valuable insights into potential market shifts, traders must integrate this pattern with other analytical tools and always consider their individual risk tolerance. For complex trading decisions, consulting with a financial expert is highly recommended.
