Decoding Market Dynamics: The Power of Elliott Wave Analysis
The Foundational Concept of Elliott Wave Theory: Pattern Recognition in Financial Markets
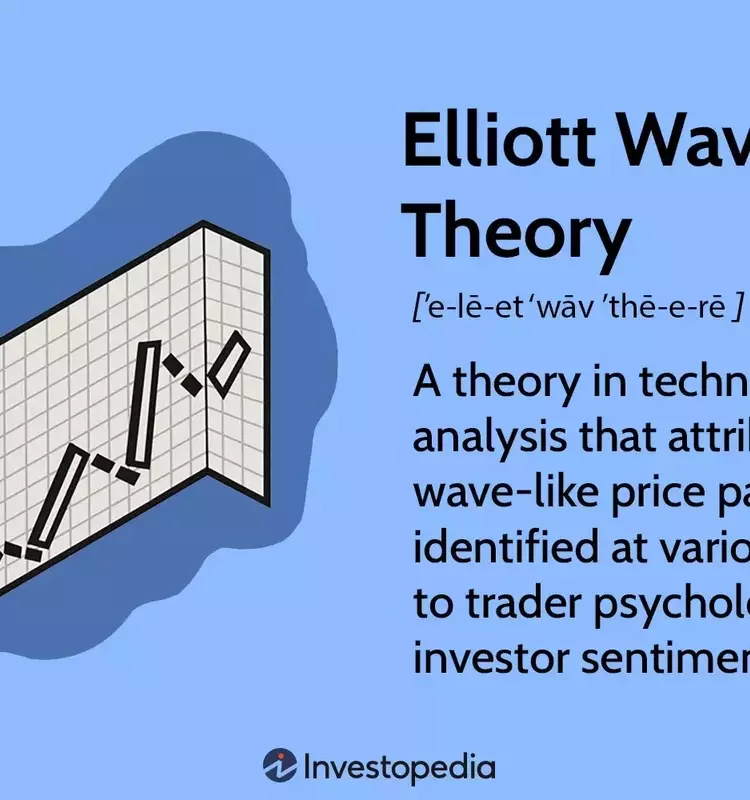
Elliott Wave Theory is a fundamental aspect of technical analysis, providing a structured approach to interpreting price movements in financial markets. Developed by Ralph Nelson Elliott in the 1930s, this theory suggests that market prices unfold in consistent, fractal wave patterns. These patterns are believed to reflect underlying investor psychology and sentiment. Elliott's work gained prominence after his accurate prediction of a significant stock market low in 1935, solidifying its place as a key tool for investors, traders, and portfolio managers seeking to identify and capitalize on market trends. The theory outlines specific guidelines for recognizing these wave formations, emphasizing that while they offer insight into market direction, they do not guarantee future outcomes.
The Evolution of Elliott Wave Analysis: From Charts to Modern Applications
Ralph Nelson Elliott meticulously studied historical market data, spanning 75 years of charts across various timeframes, to develop his wave theory. His comprehensive research led to the identification of recurring patterns in market behavior. Elliott's findings and rules for identifying and predicting wave patterns were later compiled in works such as 'R.N. Elliott's Masterworks'. Today, organizations like Elliott Wave International continue to utilize and expand upon his model for financial analysis and market forecasting. While the theory does not offer absolute certainty regarding future price action, it provides a probabilistic framework that can be effectively combined with other technical indicators for a more robust analysis.
Core Tenets: Understanding Impulse and Corrective Wave Structures
Elliott Wave Theory categorizes market price movements into two primary types: impulse (or motive) waves and corrective waves. Impulse waves typically move in the direction of the larger market trend and are composed of five sub-waves. Corrective waves, conversely, move against the larger trend and usually consist of three sub-waves. These wave patterns are fractal, meaning they repeat across different time scales, nesting within larger patterns. This self-similar nature allows analysts to observe a corrective wave on a long-term chart while simultaneously identifying an impulse wave on a shorter-term chart, influencing both long-term and short-term trading strategies.
Identifying the Driving Force: Characteristics of Impulse Waves in Market Trends
Impulse waves are the driving force behind market trends, characterized by five sub-waves that align with the prevailing direction. This structure is often the most straightforward to identify. Within an impulse wave, three sub-waves are also motive waves, while two are corrective. Strict rules govern the formation of impulse waves: the second wave cannot retrace beyond the beginning of the first wave; the third wave must not be the shortest among the three motive sub-waves (waves 1, 3, and 5); the fourth wave must not overlap with the price territory of the first wave; and the fifth wave typically concludes with momentum divergence. Any deviation from these rules necessitates a re-evaluation of the wave count.
Navigating Market Reversals: Decoding Corrective Wave Patterns
Corrective waves, also referred to as diagonal waves, represent movements that oppose the primary trend, generally comprising three or a combination of three sub-waves. Their fundamental purpose is to realign the market with the overarching trend. Key characteristics of corrective waves include: a five-sub-wave structure; a visual appearance resembling either an expanding or contracting wedge; sub-waves that do not necessarily trace back entirely to the preceding sub-wave; and the possibility that the third sub-wave is not the shortest. Understanding these nuances is crucial for accurately interpreting market reversals and consolidations.
Synergy with Fibonacci: Integrating Elliott Wave with Other Analytical Tools
Elliott recognized a profound connection between his wave patterns and the Fibonacci sequence, noting that wave relationships frequently adhere to Fibonacci ratios such as 38% and 62%. For instance, a corrective wave might retrace 38% of the preceding impulse wave. Building on this foundation, other analysts have developed indicators, such as the Elliott Wave Oscillator, which utilizes the differences between five- and 34-period moving averages to predict price direction. Advanced systems like Elliott Wave International's EWAVES leverage artificial intelligence to apply Elliott's rules and guidelines, generating automated wave analyses. This integration underscores the theory's versatility and its complementary role alongside other technical indicators for comprehensive market analysis.
